Code and tables
Syntax highlighting
Here is a sample code chunk, just to show that syntax highlighting works as expected.
say_hello <- function (name) {
  paste("Hello,", name, "!")
}

say_hello("world")
[1] "Hello, world !"Verbatim
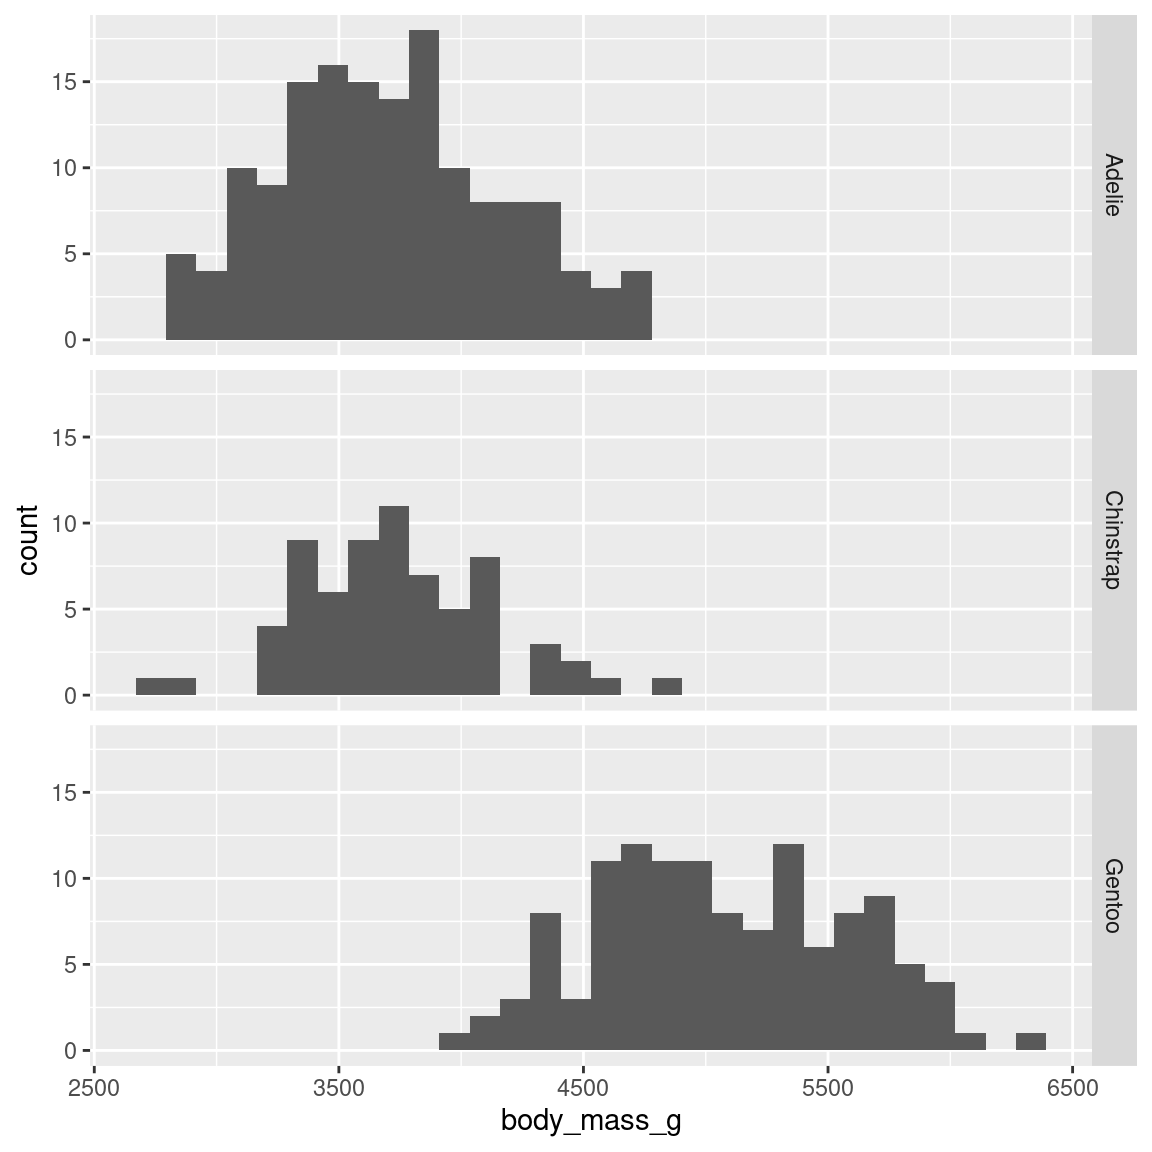
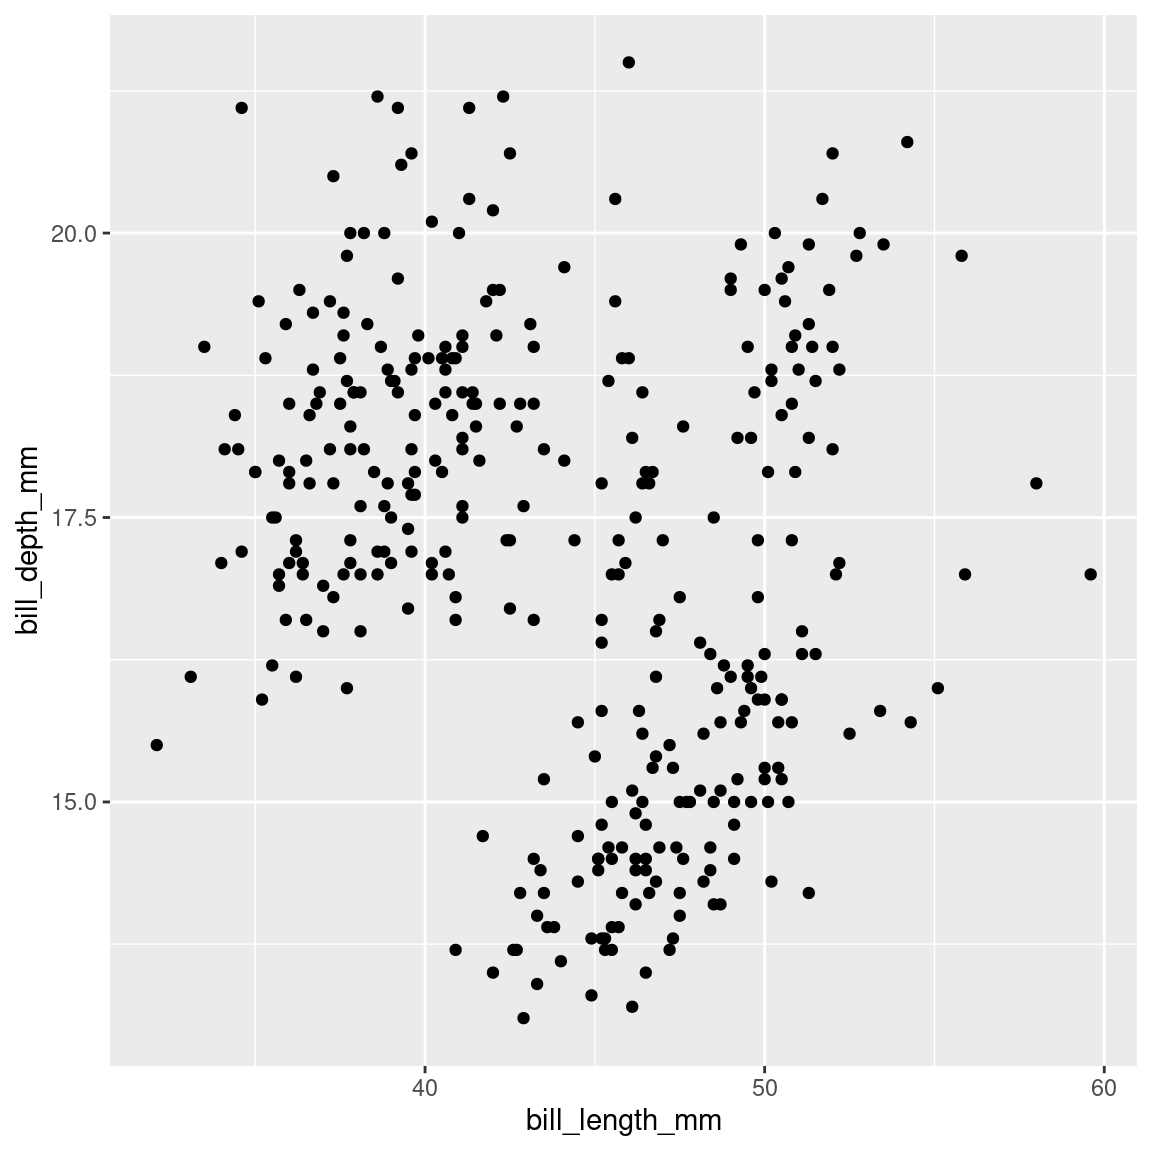
Here is the structure of the penguins dataset.
library(palmerpenguins)
str(penguins)
tibble [344 × 8] (S3: tbl_df/tbl/data.frame)
$ species : Factor w/ 3 levels "Adelie","Chinstrap",..: 1 1 1 1 1 1 1 1 1 1 ...
$ island : Factor w/ 3 levels "Biscoe","Dream",..: 3 3 3 3 3 3 3 3 3 3 ...
$ bill_length_mm : num [1:344] 39.1 39.5 40.3 NA 36.7 39.3 38.9 39.2 34.1 42 ...
$ bill_depth_mm : num [1:344] 18.7 17.4 18 NA 19.3 20.6 17.8 19.6 18.1 20.2 ...
$ flipper_length_mm: int [1:344] 181 186 195 NA 193 190 181 195 193 190 ...
$ body_mass_g : int [1:344] 3750 3800 3250 NA 3450 3650 3625 4675 3475 4250 ...
$ sex : Factor w/ 2 levels "female","male": 2 1 1 NA 1 2 1 2 NA NA ...
$ year : int [1:344] 2007 2007 2007 2007 2007 2007 2007 2007 2007 2007 ...Table
Sample table output.
| Adelie | Chinstrap | Gentoo | |
|---|---|---|---|
| Biscoe | 44 | 0 | 124 |
| Dream | 56 | 68 | 0 |
| Torgersen | 52 | 0 | 0 |
Sample DT:datatable output.
Here is a crosstab displayed in several different ways with a “pills”
interface. To do this, just pass your table() result to the
pilltabs() function.
| Adelie | Chinstrap | Gentoo | |
|---|---|---|---|
| female | 73 | 34 | 58 |
| male | 73 | 34 | 61 |
| Adelie | Chinstrap | Gentoo | Total | n | |
|---|---|---|---|---|---|
| female | 44.2 | 20.6 | 35.2 | 100 | 165 |
| male | 43.5 | 20.2 | 36.3 | 100 | 168 |
| All | 43.8 | 20.4 | 35.7 | 100 | 333 |
| Adelie | Chinstrap | Gentoo | All | |
|---|---|---|---|---|
| female | 50 | 50 | 48.7 | 49.5 |
| male | 50 | 50 | 51.3 | 50.5 |
| Total | 100 | 100 | 100.0 | 100.0 |
| n | 146 | 68 | 119.0 | 333.0 |
| Adelie | Chinstrap | Gentoo | |
|---|---|---|---|
| female | 0.08 | 0.05 | -0.13 |
| male | -0.08 | -0.05 | 0.12 |
X-squared = 0.0486, df = 2, p = 0.976
Styling
A simple list :
- one mississippi
- two mississippi
- three mississippi
A blockquote :
Oh ! What a nice blockquote you have here. Much more wonderful than a classical Lorem Ipsum, really.
And we could also include links or simply URLs like this : https://www.r-project.org/
An incredibly complex equation :
\[ y = \sqrt{\frac{1}{x + \beta}} \]