Plot an umapscan object
# S3 method for umapscan
plot(
  x,
  color,
  palette,
  label = NULL,
  ellipses = FALSE,
  alpha = 0.2,
  fixed = FALSE,
  ...
)
Arguments
| x | umapscan object to be plotted |
|---|---|
| color | variable to highlight points ( |
| palette |
|
| label | legend label |
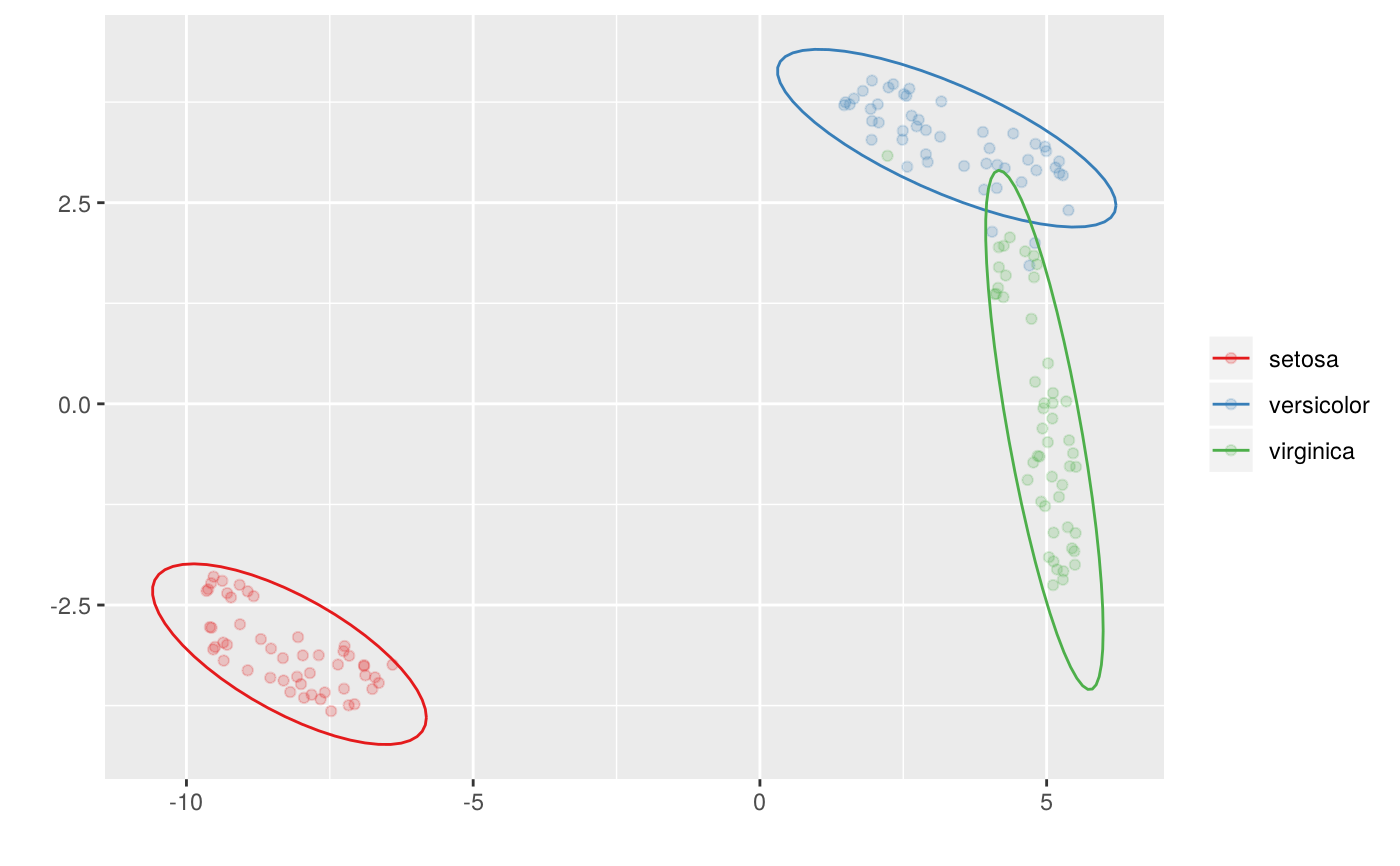
| ellipses | if TRUE and |
| alpha | points transparency |
| fixed | if TRUE, add |
| ... | arguments passed to other methods |
Examples
library(dplyr) iris_num <- iris %>% select_if(is.numeric) iris_sup <- iris %>% select(Species) us <- new_umapscan(iris_num, data_sup = iris_sup, n_neighbors = 25, min_dist = 0.1) plot(us, color = Species, ellipses = TRUE)